Since its launching in 2007, the iPhone has redefined technological standards. This device reshaped how we communicate, gather information, and do business. The first iPhone, with its innovative large touchscreen, stood out from the typical smartphones of its time.
The iPhone has set new benchmarks in the smartphone world, influencing various aspects of our lives. This device seamlessly merges a computer, iPod, camera, and phone, all navigated via a touchscreen. Its blend of user-friendly software, a clean interface, and the flexibility to add chosen apps has made it highly attractive.
Over the years, the iPhone has undergone significant changes, becoming more popular and refined with its core design and most beloved features remaining the same. In this piece, we’ll delve into the iPhone’s evolution from 2007 to 2027, highlighting its yearly sales. We’ll also discuss the iPhone’s profound influence on the smartphone market and its ripple effects across different sectors.
- iPhone Sales Key Statistics
- iPhone Sales Statistics: 2007-2023
- The First Decade (2007-2017): Rise of the iPhone
- 2007: The beginning – iPhone’s Introduction and Initial Sales
- 2008-2010: Introduction of the App Store and iPhone 3G, 3GS, and 4
- 2011-2013: The Era of the iPhone 4S, 5, and 5S/5C
- 2014-2016: Larger Screens and New Designs with iPhone 6, 6S, and 7
- 2017: iPhone 8, 8+, X and Its Impact – A Decade of Innovation
- The Second Decade (2018-2027): Evolution and Future Expectation
- iPhone Comparisons: The Statistics
- Conclusion
- FAQs
iPhone Sales Key Statistics
- In 2022, Apple reported an impressive revenue of $394.3 billion, of which a significant 52% or $205.5 billion was attributed to iPhone sales.
- Holding a 23.4% stake in the global smartphone market, Apple’s iPhone outperforms all other mobile phone brands.
- Presently, there are more than one billion active users of the iPhone devices.
- Since it first launched in 2007, more than 1.9 billion iPhones have been sold out.
- In 2022, the Apple company recorded 225.3 million iPhones shipments.
- In the US, iPhones account for 65% of smartphone sales.
- Apple currently offers eight different iPhone models with prices varying between $429 and $1,599.
- In Q1 2023, the iPhone 14 Pro and Pro Max emerged as top sellers, securing 22% and 24% of the total market share, respectively.
- At the end of 2023 second quarter, the iPhone 14 Pro Max was the latest and greatest iPhone model.
iPhone Sales Statistics: 2007-2023
The Apple iPhone has seen many changes since it launched in 2007. It has seen a surge in market share, the revenue and number of shipments.
iPhone Annual Market Market
As of June 20231, the iPhone holds a 28.44% share of the mobile operating system market.
| Years | Market Share |
| 20072 | 3% |
| 20082 | 9% |
| 20092 | 14% |
| 20102 | 15% |
| 20112 | 18% |
| 20122 | 18% |
| 20132 | 15% |
| 20142 | 15% |
| 20152 | 16% |
| 20162 | 14% |
| 20172 | 14% |
| 20182 | 14% |
| 20192 | 13% |
| 20202 | 15% |
| 20212 | 17% |
| 20222 | 18% |
| 20231 | 28% |

iPhone Annual Revenue
In the first quarter of fiscal 20233, the revenue generated from the iPhone sales was $65.78 billion.
| Years | Sales Revenues in ($Million) |
| 20074 | 123 |
| 20084 | 1,844 |
| 20094 | 13,033 |
| 20104 | 25,179 |
| 20114 | 45,998 |
| 20124 | 78,692 |
| 20134 | 91,279 |
| 20144 | 101,991 |
| 20154 | 155,041 |
| 20164 | 136,700 |
| 20174 | 141,319 |
| 20184 | 166,269 |
| 20194 | 142,381 |
| 20204 | 137,781 |
| 20214 | 191,973 |
| 20224 | 205,489 |

iPhone Annual Shipments
During the second quarter of 20235, iPhones shipment declined by almost 15 million units from the previous quarter record total as close to 42.5 million units were shipped.
| Years | Annual Shipment in (Million Unit) |
| 20074 | 1.39 |
| 20084 | 11.63 |
| 20094 | 20.73 |
| 20104 | 39.99 |
| 20114 | 72.29 |
| 20124 | 125.05 |
| 20134 | 150.26 |
| 20144 | 169.22 |
| 20154 | 231.22 |
| 20164 | 211.88 |
| 20174 | 216.76 |
| 20184 | 217.72 |
| 20194 | 190.60 |
| 20204 | 206.10 |
| 20214 | 233.90 |
| 20224 | 225.30 |
| 20235 | 42.5 |

- Initial Growth (2007-2010): The graph indicates a rapid increase in annual shipments from 2007 to 2010. Starting from a modest 1.39 million units in 2007, the iPhone shipments grew exponentially to reach nearly 40 million units by 2010.
- Steady Rise (2011-2015): The period from 2011 to 2015 saw a consistent and significant rise in shipments. By 2015, the shipments had reached a peak of 231.22 million units, marking an impressive growth from the previous years.
- Plateau and Minor Fluctuations (2016-2018): Post-2015, the growth seemed to plateau. The years 2016 to 2018 witnessed minor fluctuations, with the shipments hovering around the 210-220 million units mark. This could indicate market saturation or the maturity phase of the iPhone lifecycle.
- Slight Decline (2019): In 2019, there was a noticeable decline to 190.6 million units. This could be due to various factors such as market competition, economic conditions, or changes in consumer preferences.
- Recovery (2020-2021): The shipments rebounded in 2020 and reached a new peak in 2021 with 233.9 million units. This suggests a resurgence in demand or successful business strategies implemented during this period.
- Slight Dip (2022): The year 2022 saw a minor decrease to 225.3 million units, but it was still among the highest recorded years.
The asterisk shows that 2023 is still on. Meanwhile, the value shown in the above table for the year represents the year’s second quarter number of shipments.
Sources: MS Power User1, Counterpoint Research2, Investing3, BankMyCell4, Statista5
The First Decade (2007-2017): Rise of the iPhone
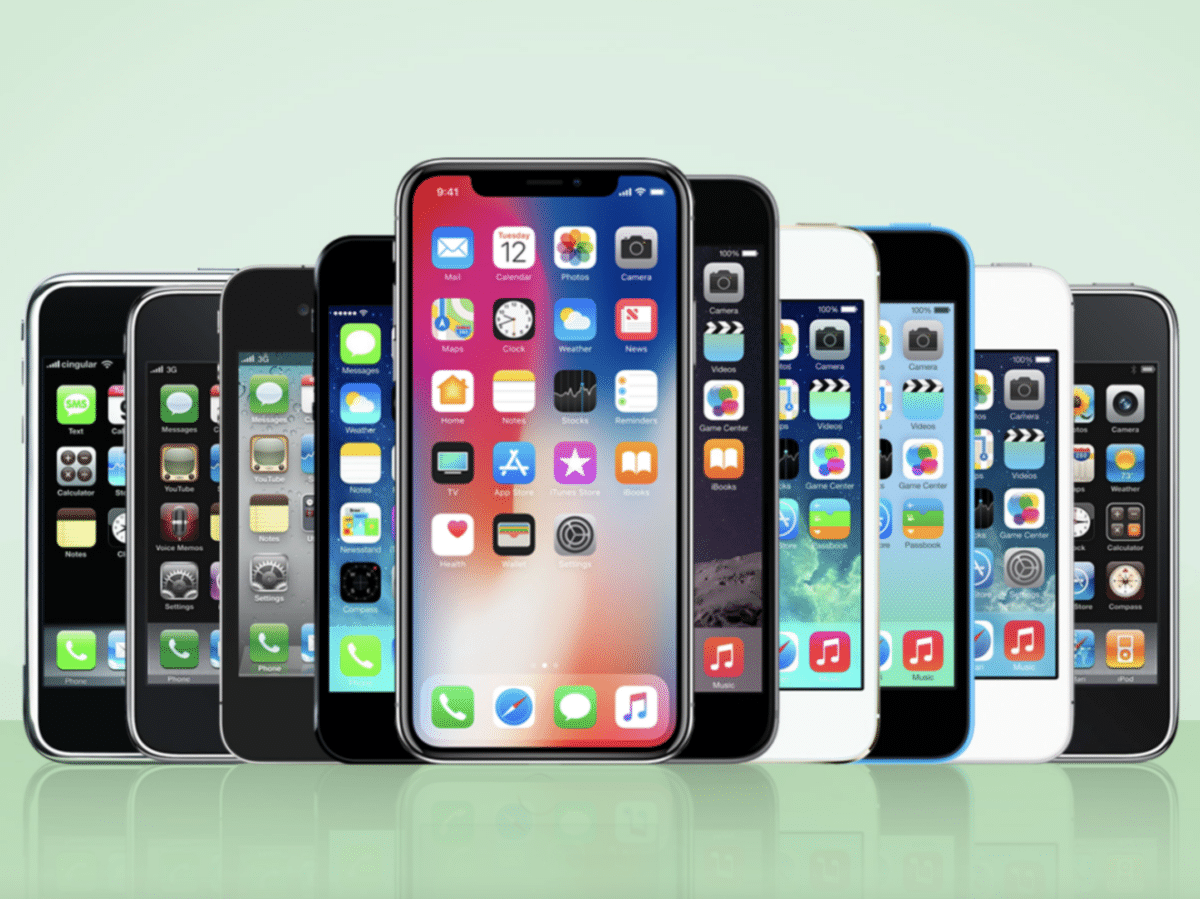
The rise of the iPhone saw its first decade transforming from one model to the other. The major upgrades in the first decades include the following:
2007: The beginning – iPhone’s Introduction and Initial Sales
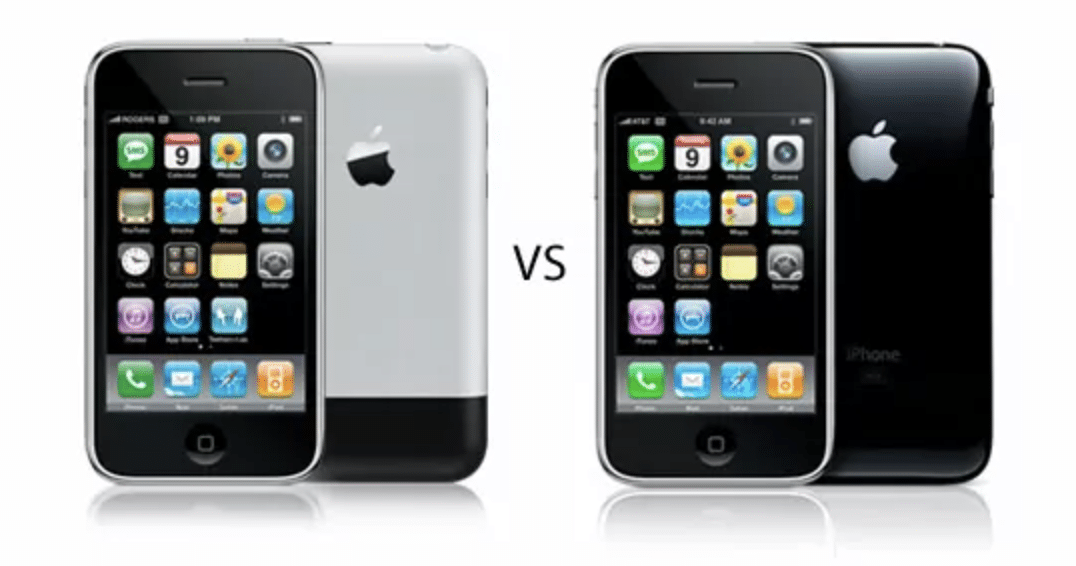
In 2007, Apple’s CEO, Steve Jobs, unveiled the iPhone at the Macworld convention. Released in June, the initial models were priced at $499 for 4GB and $599 for 8GB, both with a two-year contract. This iPhone featured a 3.5-inch screen, a 2-megapixel camera, and introduced multitouch.
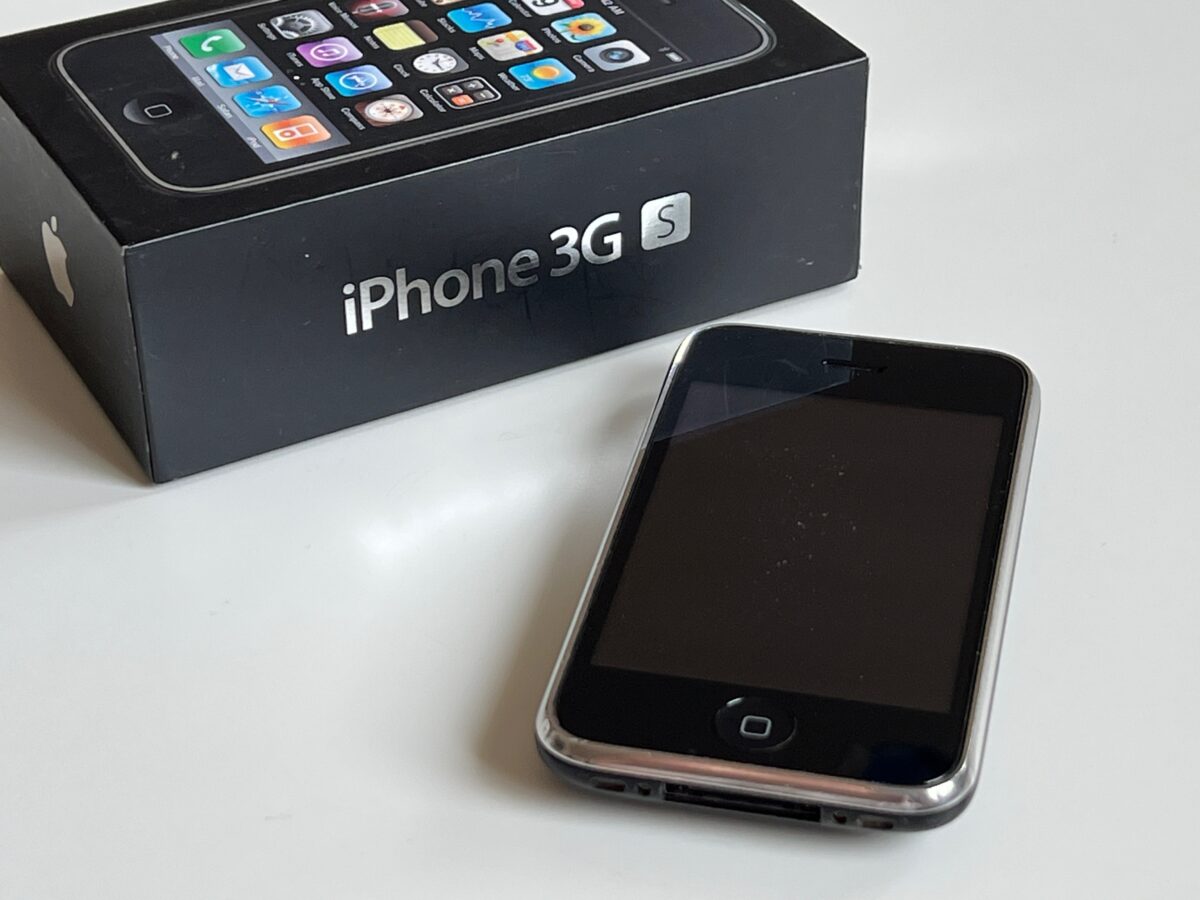
2008-2010: Introduction of the App Store and iPhone 3G, 3GS, and 4
From 2008 to 2010, Apple launched the App Store, transforming user-device interaction. That year, the iPhone 3G with faster internet and GPS was released. In 2009, the iPhone saw the release of 3GS which offered better performance and an upgraded camera. By 2010, the redesigned iPhone 4 with a glass body and Retina display was introduced.
2011-2013: The Era of the iPhone 4S, 5, and 5S/5C
Between 2011 and 2013, the iPhone 4S debuted with an improved camera, Siri, and iCloud. The iPhone 5, released in 2012, had a 4-inch screen and the new Lightning connector. In 2013, Apple introduced the iPhone 5S with Touch ID and the affordable, colourful iPhone 5C.
2014-2016: Larger Screens and New Designs with iPhone 6, 6S, and 7
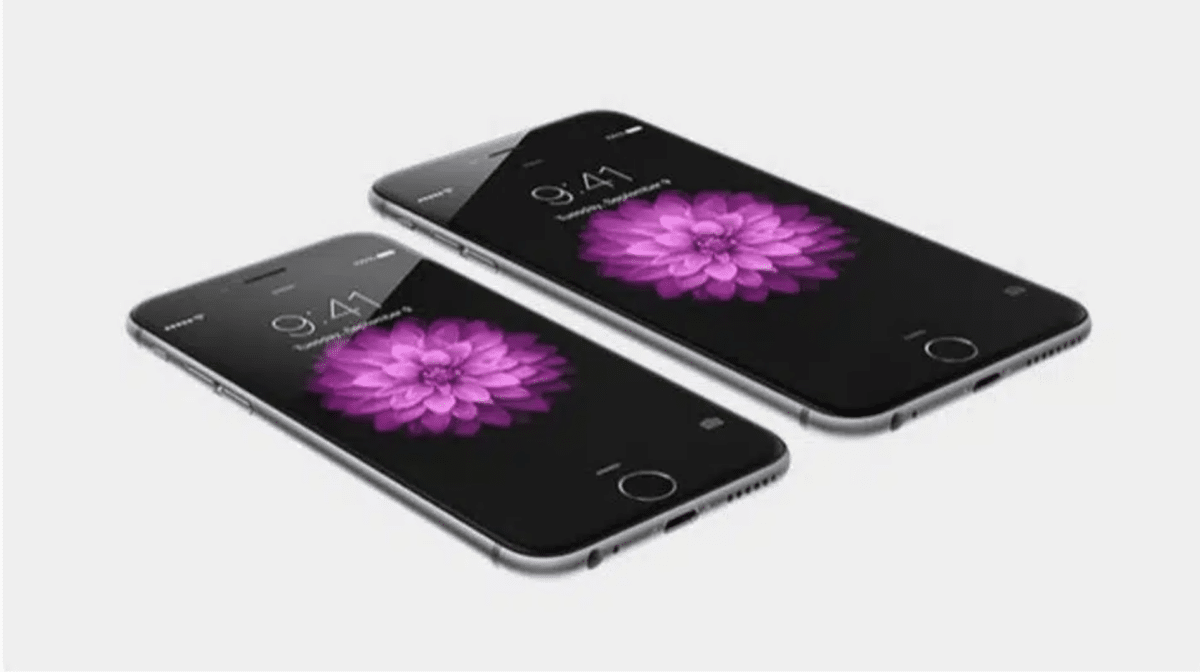
From 2014 to 2016, Apple released the larger iPhone 6 and 6 Plus. The 2015 models, iPhone 6S and 6S Plus, introduced 3D Touch and better cameras. In 2016, the iPhone 7 and 7 Plus emerged, notable for removing the headphone jack and adding water resistance.
2017: iPhone 8, 8+, X and Its Impact – A Decade of Innovation
In 2017, marking the iPhone’s 10th anniversary, Apple launched the iPhone 8 series and the X series. The model X series showcased a bezel-less design, Face ID, and OLED technology. This symbolizes a decade of innovation and hinting at future smartphone advancements.
Sources: Computer World
The Second Decade (2018-2027): Evolution and Future Expectation
The second decade of the iPhone, spanning from 2018 to 2027, was characterized by both evolution and challenges. As technology advanced, Apple consistently pushed the boundaries of what a smartphone could achieve.
2018-2020: iPhone XR, XS, iPhone 11 Series, and 12 Series
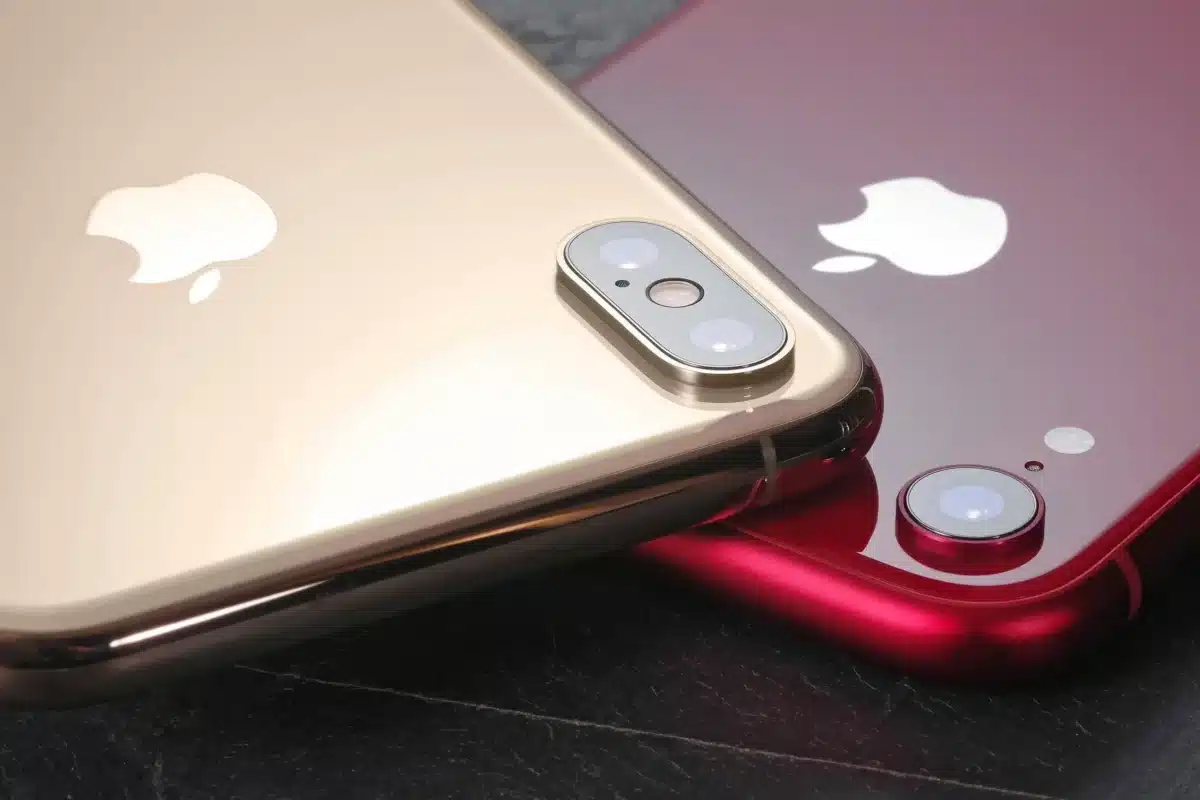
In 2018, Apple introduced the iPhone XR and XS, offering enhanced performance and features. 2019 saw the launch of the iPhone 11 series, including the Pro and Pro Max versions, notable for their advanced cameras and processing power. By 2020, the iPhone 12 series emerged, characterized by its flat-edged design, 5G support, and the A14 Bionic chip.
2021: iPhone 13 Series
2021 marked the debut of the iPhone 13 series, encompassing the Mini, Pro, and Pro Max models. These devices showcased advancements in camera technology, display quality, and processing speed.
2022-2023: iPhone 14 Series
In 2022, the iPhone 14 series was unveiled, including Plus, Pro, and Pro Max versions. These models are anticipated to offer superior performance, camera capabilities, and design refinements.
2023-2027: Future Possibilities
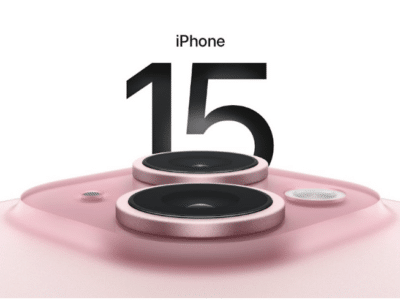
Looking towards 2023-2027, there’s speculation about the iPhone 15’s release, though specific details are yet to be confirmed. Given Apple’s history, the upcoming years promise exciting innovations.
Sources: Apple Support
iPhone Comparisons: The Statistics
iPhones are available in many regions of the world today. Likewise, today’s world has seen iOs and Android competing for market share, as iPhone represents the iOs smartphones. We’ll compare, majorly, statistics that are significant in relation to the iPhone.
Global Comparisons: iPhone Total Unit vs Total Active iPhone
In 20235, over 1.46 million individuals globally are active iPhone users, representing 21.67% of the total smartphone user base worldwide.
Below is the worldwide comparisons of the total unit of iPhone and the active iPhone total units worldwide:
| Year | Total Units in Mn | Active Units in Mn |
| 2014 | 169.222 | 4426 |
| 20-15 | 231.222 | 5696 |
| 2016 | 211.882 | 7106 |
| 2017 | 216.762 | 8146 |
| 2018 | 217.722 | 8886 |
| 2019 | 190.602 | 9486 |
| 2020 | 206.102 | 10426 |
| 2021 | 233.902 | 12316 |
| 2022 | 225.302 | 13346 |
| 2023 | 42.54 | 1460+5 |
iPhone Users Comparison by Gender
The number of females using iPhone is 51% compared to 49% of males using the iPhone.

iPhone Users Comparison by Age
Certain age groups use iPhones more than the other categories. The list of how the groups are ranked are shown below:
| Age Groups | User’s Percentage |
| 18-247 | 22% |
| 25-347 | 27% |
| 35-447 | 23% |
| 45-547 | 10% |
| 54-647 | 8% |
| 65 above7 | 10% |

The iPhone has a broad appeal across various age groups, with its highest popularity among young and mid-aged adults. Its combination of style, functionality, and brand reputation makes it a preferred choice for many. The data also suggests that Apple’s efforts in making the iPhone accessible have been successful, as evidenced by its adoption by both the very young and the elderly.
The United States vs Global iPhone Sales Comparison
In Q2 2023, Apple’s iPhones sales composed 16% of the total global smartphone sales.
iPhone Sales in Million Units
| Year | Worldwide (mn) | United States (mn) |
| 2013 | 153.41 | 61.822 |
| 2014 | 192.71 | 79.122 |
| 2015 | 231.51 | 79.392 |
| 2016 | 215.41 | 86.912 |
| 2017 | 213.31 | 88.282 |
| 2018 | 208.81 | 82.592 |
| 2019 | 1911 | 77.062 |
| 2020 | 206.11 | 74.452 |
| 2021 | 233.91 | 81.962 |
| 2022 | 225.31 | 72.622 |
| 2023* | 97.71 | 72.282 |
iOs vs Android Market Share in the United States
In the United States, the iPhone market share witnessed a 55% increase in the second quarter of 20238.
The table below gives a direct analysis as they compare.
| Years | iOs Share | Android Share | 24.03% |
| 20133 | 52.79% | 39.25% | 23.95% |
| 20143 | 52.3% | 42.58% | 20.2% |
| 20153 | 50.85% | 46.2% | 19.29% |
| 20163 | 53.19% | 45.2% | 19.65% |
| 20173 | 53.89% | 45.23% | 20.47% |
| 20183 | 54.82% | 44.73% | 22.71% |
| 20193 | 55.23% | 44.51% | 26.28% |
| 20203 | 59.54% | 40.27% | 27.34% |
| 20213 | 58.58% | 41.11% | 27.85% |
| 20223 | 56.74% | 42.94% | 29.00% |
| 20233 | 58.34% | 41.24% |
Sources: Statista1, BankMyCell2, BankMyCell3, Statista4, Demand Sage5, Business of Apps6, 9TO5Mac7, 9TO5Mac8,
Also read: The best iPhone to buy in 2024
Conclusion
The iPhone has had a remarkable journey since it was introduced in 2007. Within 74 days, it captivated a million users. Same year, Apple recorded sales of over 1.39 million iPhones. What set the iPhone apart were its groundbreaking features like the multi-touch interface and its trailblazing software. Its sales figures, unwavering support, and relentless innovation solidify its commanding presence in the mobile world.
FAQs
The iPhone XR holds the record as the top-selling iPhone ever, boasting sales of 246.2 million units. Not far behind is the iPhone 11, with a commendable 193.2 million units sold. The affordability of the iPhone XR, combined with its array of sought-after features, is a key factor in its widespread popularity.
North Korea stands out as the leading market for iPhones, boasting a staggering 99.49% market share. Interestingly, iPhones are perceived as more secure compared to the officially sanctioned phones in the nation, which are frequently under government surveillance. This has resulted in a robust underground market for iPhones within the country.
The iPhone 5C didn’t achieve the sales Apple had hoped for. Even though it was presented as a budget-friendly choice, it faced criticism for its plastic build and minimal upgrades compared to the iPhone 5.
Throughout the world, Android has consistently dominated the market share when compared to iOS. Android boasted a global market share of 71.65% in the first quarter of 2023, whereas iOS trailed with 27.71%.