Tesla, Inc., founded in 2003 by Martin Eberhard and Marc Tarpenning, is an American multinational automotive and clean energy company. The company revolutionized the way we think about electric vehicles and played a significant role in the automotive industry.
Tesla designs and manufactures electric vehicles, stationary battery energy storage devices, solar panels, and related products and services. The company not only transformed how we think about electric vehicles but also accelerated the adoption of electric vehicles on a global scale.
Tesla’s contributions to the automotive industry sparked a new era characterized by a Silicon Valley approach to software and innovation. As Tesla continues to push the boundaries of electric vehicle technology, it remains a key player in shaping the future of the automotive industry.
In this report, you’ll find out everything you need to know about Tesla Inc.
Tesla Incorporated Key Statistics
- Market Cap: Tesla’s total market value is $791.42 billion.
- Revenue for 2022: Tesla’s revenue for 2022 is $81.462 billion.
- Total Q2 revenues: Tesla’s total revenue for Q2 2023 was $24.93 billion.
- Gross Margin (TTM): Tesla’s gross margin over the past 12 months was 25.60%.
- Shares Outstanding: Tesla has 3.17 billion shares outstanding.
- Employees: Tesla has 127,855 employees at the end of 2022.
- Revenue per Employee: Tesla’s revenue per employee is $735,427.
- Revenue Growth (YoY): Tesla’s year-over-year revenue growth is 51.35%.
- Net Income: Tesla’s net income in 2022 is $12.55 billion.
- Net Profit Margin: Tesla’s Q4 net profit margin in 2022 is 15.27%.
- EPS (TTM): Tesla’s earnings per share over the past 12 months is $3.62.
- % Held by Insiders: 13.04% of Tesla’s shares are held by insiders.
- % Held by Institutions: 42.84% of Tesla’s shares are held by institutions.
- Short % of Float: 3.37% of Tesla’s shares are sold short.
- Short % of Shares Outstanding: 2.93% of Tesla’s shares outstanding are sold short.
- Tesla Supercharger stations: Tesla has Supercharger stations in over 40 countries, with the majority located in the USA, China, Canada, Germany, France, United Kingdom, Norway, Sweden, South Korea, and Italy.
- Tesla vehicle deliveries: Tesla delivered a record 935,950 vehicles in 2021.
- Tesla sales in China: Tesla sold 473,103 vehicles in China in 2021.
- Tesla sales in Europe: Tesla sold 30,911 vehicles in the Netherlands, 18,798 in Norway, and 10,711 in Germany in 2019.
- Tesla annual car production: Tesla produced 479,700 vehicles in Q2 2023.
Tesla Sales Statistics for 2023
Starting with the Lotus Elise-based electric sports car Tesla Roadster in 2008, Tesla sold a total of 4,527,916 electric vehicles as of July 20231.
Below is the breakdown of the year-over-year sales.
Table One: Tesla Sales by Vehicle Models Sold Since 2008
| Year | Total Sales | Vehicle Models Sold |
| 2008 | ~100 | Roadster |
| 2009 | ~900 | Roadster |
| 2010 | ~400 | Roadster |
| 2011 | 774 | Roadster |
| 2012 | 3,000 | Roadster, Model S |
| 2013 | 22,477 | Model S |
| 2014 | 31,655 | Model S |
| 2015 | 50,658 | Model S, Model X (Q4 ’15) |
| 2016 | 76,285 | Model S, Model X |
| 2017 | 103,181 | Model S/X, Model 3 (Q3 ’17) |
| 2018 | 245,506 | Model S/X, Model 3 |
| 2019 | 354,245 | Model S/X, Model 3 |
| 2020 | 499,647 | Model S/X, Model 3/Y |
| 2021 | 936,222 | Model S/X, Model 3/Y |
| 2022 | 1,313,851 | Model S/X, Model 3/Y |
| 2023* | 889,015 | Model S/X, Model 3/Y |
| TOTAL1 | 4,527,916 | Vehicles |
Total Number of Tesla Vehicles Sold in Q2 2023
The total number of Tesla vehicles sold in Q2 20232 is 466,140.
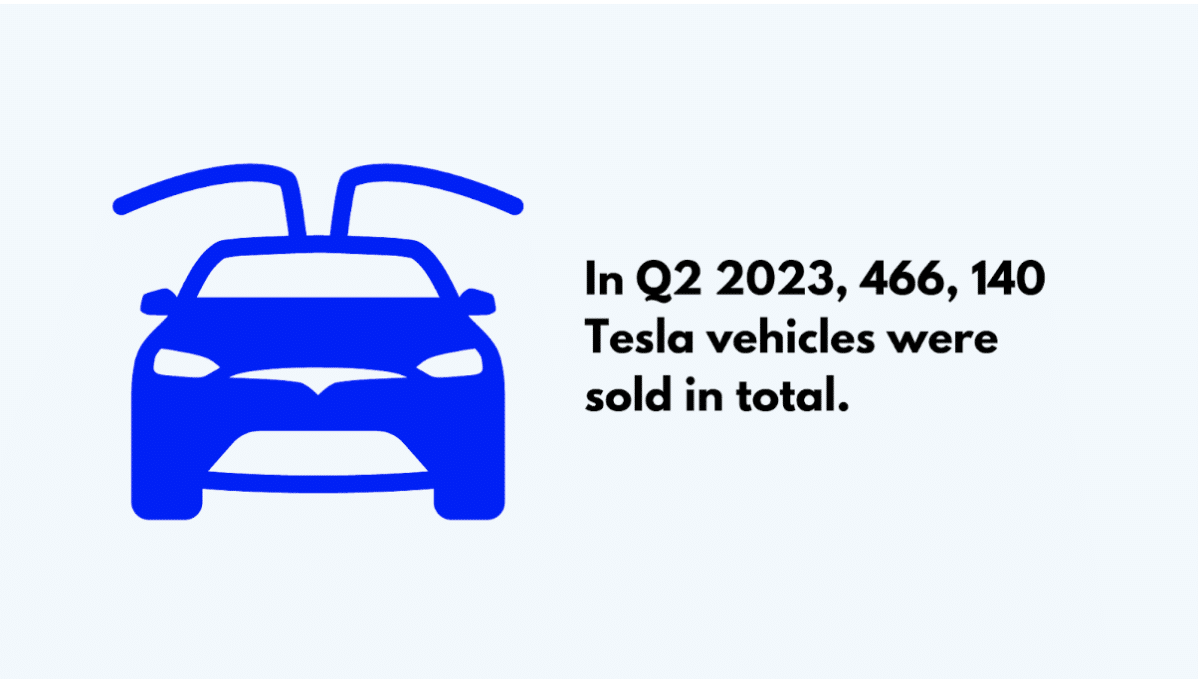
The above is a record of deliveries for Tesla in a single Quarter. The increase in deliveries in the second quarter is attributed to price cuts, sales incentives, and expansion of production capacity.
Tesla Vehicle Models Sold in Q2 of 2023
The breakdown of the vehicle models sold in Q2 2023 is as follows:
Model 3/Model Y3
Tesla combinedly delivered 446,915 units of Model 3 and Model Y.
Model S/Model X3
Tesla delivered a total of 19,225 units of Model S and Model X combined.
Table Two: Tesla Vehicle Models Sold in Q2 of 2023
| Vehicle Models | Total Deliveries |
| Model 3 and Model Y | 446,915 |
| Model S and Model X | 19,225 |
| TOTAL | 466,140 |
Tesla’s Sales by Region
Tesla thrives most in three regions of the world when it comes to sales: the United States, China, and Europe. Let’s take a look at the sales figures in these regions.
United States
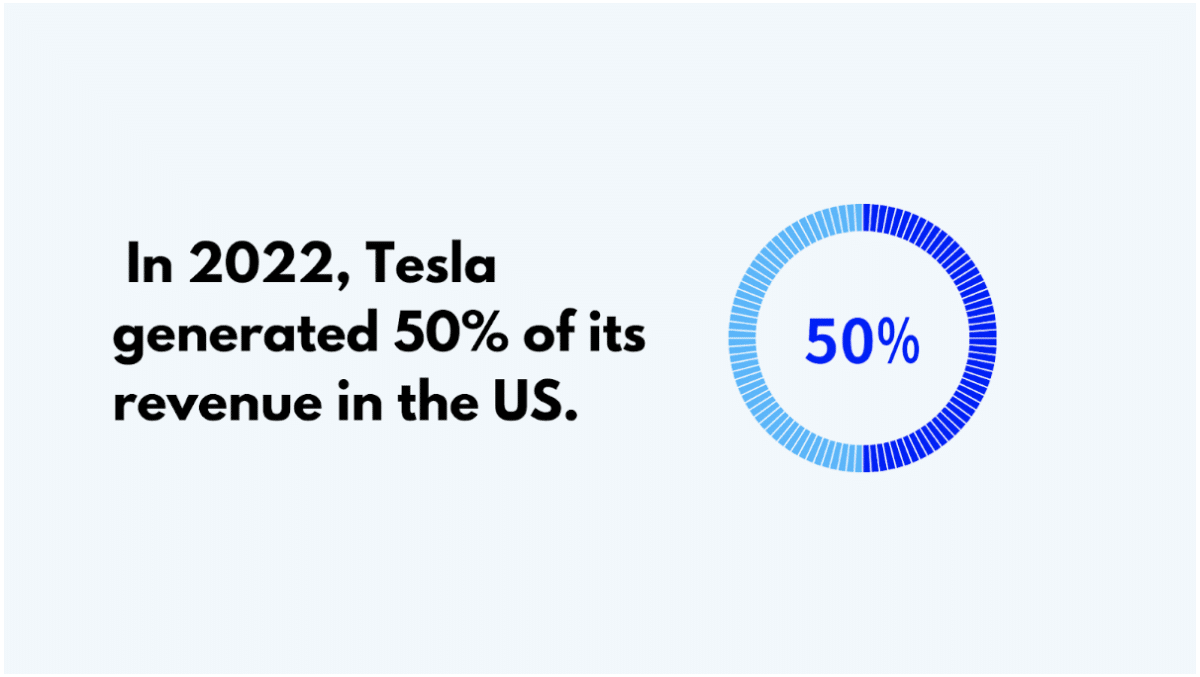
In 20224, almost 50% of Tesla’s revenue was generated in the US.
In Q1 20235, Tesla sold almost 181,000 cars in the US.
China
China generated more than 22% of Tesla’s revenue in 20224.
In Q1 2023, China recorded its best quarter for Tesla sales by selling approximately 229,000 vehicles.
Europe
In 20225, total number of Tesla sold in Europe was 234,194, which is more than 17% of the world’s total sales.
94,696 Tesla’s cars were sold in Q1 20235 in Europe.
Tesla Sales in the US, China, and Europe (2018-2023*)
Here are how the sales in these three regions compare since 2018 till present.
Table Three: Tesla Sales in the US, China and Europe
| Year | United States | China | Europe |
| 2018 | 48,0006 | None | 29,614 |
| 2019 | 195,1256 | None | 111,728 |
| 2020 | 292,9026 | 135,4497 | 97,957 |
| 2021 | 301,9986 | 473,1037 | 169,507 |
| 2022 | 536,0696 | 439,7708 | 234,1945 |
| 2023* (Q1) | 181,0005 | 137,4299 | 94,6965 |
| TOTAL | 1,555,094 | 1,185,751 | 737,696 |
Tesla (TSLA. O) sold 267,171 Model Ys in the first quarter of this year according to a source. Of these, 94,469 were sold in China, which is higher than the number sold in the United States (83,664) and Europe (71,114).
Tesla Vehicle Model Sales Comparisons
Tesla has four vehicle Models, and here are some comparisons:
Table Four
| Year | Model Y | Model 3 | Model X | Model S |
| Starting Price | $47,490 | $40,240 | $98,490 | $88,490 |
| Unit Sold/Q23 | 446,915 deliveries for Model Y and 3 | 19,225 deliveries for Model X and S | ||
| Unit roduced3 | 460,211 for Model Y/3 | 19,489 for Model X/S | ||
| Unit Sold 2022 | 747,500 | 240,266 | 31,371 | 176, 372 |
| Seating Capacity | 5-7 passengers | 5 passengers | 5 passengers | 5 passengers |
Sources: Licarco1, CNBC2, Inside EVs3, Four Week MBA4, Tridens Technology5, GoodCarBadCar6, World Population Review7, CNEVPOST8, Car News China9, Car Sales Base, Business Insider, Car Figures, Reuters
Tesla Revenue and Financial Performance Statistics
Tesla Motors released its first car, the electric Roadster in 2008. Since then, their revenues have been increasing year-over-year.
Tesla’s revenue grew to nearly $81.5 billion in the 2022 fiscal year, a 51% increase from the previous year.
The table below shows the fiscal year revenues from 2008-2022.
Table Five: Comparison of Tesla’s Revenue with Previous Years
| Year | Revenues ($billion) |
| 20081 | 0.015 |
| 20091 | 0.112 |
| 20101 | 0.117 |
| 20111 | 0.204 |
| 20121 | 0.413 |
| 20131 | 2.014 |
| 20141 | 3.198 |
| 20151 | 4.046 |
| 20161 | 7.000 |
| 20171 | 11.759 |
| 20181 | 21.461 |
| 20191 | 24.578 |
| 20201 | 31.536 |
| 20211 | 53.823 |
| 20221 | 81.462 |
| 2023 Q22 | 24.927 |
Tesla’s revenue for the twelve months ending June 30, 2023 was $94.028 billion. This is a 39.99% increase year-over-year.
Tesla’s Quarterly Revenue Growth From 2019 to 2023*
Table Six: Tesla Quarterly Revenues From 2019 to 2023
| Year2 | Revenues ($billion) |
| Q1 2019 | 4.541 |
| Q2 2019 | 6.350 |
| Q3 2019 | 6.303 |
| Q4 2019 | 7.384 |
| Q1 2020 | 5.985 |
| Q2 2020 | 6.036 |
| Q3 2020 | 8.771 |
| Q4 2020 | 10.744 |
| Q1 2021 | 10.389 |
| Q2 2021 | 11.958 |
| Q3 2021 | 13.757 |
| Q4 2021 | 17.719 |
| Q1 2022 | 18.756 |
| Q2 2022 | 16.934 |
| Q3 2022 | 21.454 |
| Q4 2022 | 24,318 |
| Q1 2023 | 23.329 |
| Q2 2023 | 24.927 |
Breakdown of Tesla Revenue by Segment
Tesla generates revenue through operations in different reportable segments, including automotive leasing, automotive sales, regulatory credits, energy generation and storage, and services. The following is a breakdown of Tesla’s revenue by segment:
Table Seven: Tesla Revenue by Segment in 2022
| Segment | Revenue ($billion) | % Contribution |
| Automotive Sales | 67.21 | 83% |
| Regulatory Credits | 1.77 | 2% |
| Leasing | 2.47 | 3% |
| Services | 6.00 | 7% |
| Energy Generation and Storage | 3.9 | 5% |
| TOTAL | 81.46 |
Tesla Revenue Contribution by Geographical Segment
The United States was Tesla’s largest market for 2022, followed by China. Here’s the contribution by geographical location.
Table Eight: Tesla Revenue by Geography
| Country4 | Revenue ($billion) | % Contribution |
| United States | 40.55 | 49.78% |
| China | 18.15 | 22.27% |
| Others | 22.76 | 27.95% |
| TOTAL | 81.46 |
In 2022, the United States and China accounted for 72.05% of Tesla’s total global revenue generation.
Factors Influencing Tesla Revenue Growth
A combination of internal and external factors have influenced Tesla’s revenue growth. Here are some of the key factors:
Internal Factors
Product Innovation: Tesla drives revenue growth through product innovation. The company’s ability to innovate and introduce new products such as the Cybertruck and the Semi differentiates itself from competitors and attracts customers interested in cutting-edge technology.
Production Efficiency: Tesla can increase profit margins and revenue growth by improving production efficiency and reducing costs. The company has been working to improve its production processes and increase automation to reduce costs and improve efficiency.
Sales and Marketing: Tesla influences consumer demand and revenue growth through its sales and marketing efforts, including its target market and advertising campaigns. The company has been successful in building a strong brand and attracting customers interested in environmentally-friendly and technologically-advanced vehicles.
External Factors
Economic Growth: High consumer purchasing power and a strong economy increase the demand for vehicles, including electric vehicles (EVs) such as Tesla. As the global economy grows, more consumers have the financial means to purchase luxury vehicles like Tesla’s.
Government Incentives and Subsidies: Tesla’s revenue growth can be affected by the availability of government incentives and subsidies for electric vehicles. Incentives such as tax credits and rebates can make Tesla’s vehicles more affordable for consumers and increase demand.
Competition: Tesla’s market share and revenue growth can be impacted by the rise of competition from other electric vehicle manufacturers, such as Ford, Chevrolet, Hyundai, Kia, and Volkswagen. As more companies enter the EV market, Tesla will face increased customers’ competition.
Cost of Gasoline: Consumer demand for electric vehicles, including Tesla’s, can be influenced by the cost of gasoline. When gasoline prices are high, consumers may be more likely to consider purchasing an electric vehicle to save money on fuel costs.
Sources: Statista1, Macrotrends2, FourWeekMBA3, China Daily4,
Tesla Production Statistics
Tesla produced a total of 920,807 electric cars globally in the first half of 2023.
Q1 Production for 2023
Tesla produced 440,808 vehicles in the first quarter of 20231.
Model Production for the Quarter
For the first quarter of 20233, Model 3/Y vehicles accounted for 421,371 production, while Model S/X accounted for 19,437 production.
Q2 Production for 2023
Tesla’s total production for the second quarter of 20232 was 479,999.
Model Production for the Quarter
In the second quarter of 2023, Model 3/Y vehicles accounted for the majority of the production. The Model production was 460,211, while Model S/X vehicle production was 19,788.
Table Nine: Tesla Production for 2023 Q1 and Q2
| Quarter | Production | Model 3/Y | Model S/X |
| Q11 | 440,808 | 421,371 | 19,437 |
| Q22 | 479,999 | 460,211 | 19,788 |
| TOTAL | 920,807 | 881,582 | 39,255 |
Based on the information on the above table, Model 3/Y totalled 881,582 production in the first of 2023, while Model S/X accounted for 39,255 production.
Tesla Manufacturing Locations
Tesla currently operates six Gigafactories where it produces its cars and batteries. The company plans to announce two additional locations in the future.
Table Ten: Tesla Manufacturing Locations
| Factory Name5 | City5 | Country5 |
| Tesla Fremont Factory | Fremont, California | United States |
| Gigafactory Nevada | Storey County, Nevada | United States |
| Gigafactory New York | Buffalo, New York | United States |
| Gigafactory Shanghai | Shanghai | China |
| Gigafactory Berlin-Brandenburg | Grünheide | Germany |
| Gigafactory Texas | Austin, Texas | United States |
| Gigafactory Mexico | Monterrey, Nuevo Leon | Mexico (Future) |
| Tesla Shanghai Megafactory | Shanghai | China (Future) |
Tesla’s Supercharger Network and Location
Tesla has the largest global, fast-charging network in the world with over 45,000 Superchargers. These Superchargers are located on major routes near convenient amenities, and the locations are in more than 407 countries.
Supercharging Location in the US
The United States has roughly 17,000 superchargers across 6,1808 locations throughout the States. California has the majority of Tesla’s Supercharger locations with 344, while Florida, Texas, New York, and Virginia round out the top five.
To find Tesla Supercharger locations in the United States, you can visit Tesla’s website. Third-party websites such as supercharge.info, PlugShare, or the Supercharger map for Tesla app can also be used. Another website that provides a map of Tesla Supercharger locations is Tesla Supercharging Locations by GeoMarvel.
Supercharging Location in China
Tesla operates over 1,600 Supercharging stations in China, with over 10,000 Superchargers as of April 20239. The number of Tesla Supercharging stations on the Chinese Mainland was above 1,500 in December 2022 compared to 1,000 units in October of the same year. Tesla’s Supercharging network in China is considered one of the densest and most accessible in the country, covering more than 320 cities9.
Also, Tesla operates over 700 destination charging stations in China with more than 1,9009 individual stalls. Recently, Tesla has opened up its Supercharger network in China to non-Tesla electric cars starting with a pilot program in Beijing and Shanghai that includes 10 Supercharger stations for 37 different electric vehicle models.
Supercharging Location in Europe
As of the end of Q29, there were over 38,500 Superchargers in Europe. Tesla has been opening more Superchargers in Europe for third-party use, similar to China. This allows electric cars from other brands to use them.
The table below shows the top 10 countries with the highest number of Supercharging stations in Europe.
Table Eleven: Top 10 Superchargers Locations in Europe
| Supercharger Stations | Numbers |
| Germany9 | 143 |
| France9 | 123 |
| United Kingdom9 | 100 |
| Norway9 | 95 |
| Sweden9 | 65 |
| Italy9 | 59 |
| Spain9 | 50 |
| Netherlands9 | 39 |
| Austria9 | 27 |
| Switzerland9 | 27 |
Sources: TechCrunch1, TechCrunch2, IR Tesla3, CNN4, Wikipedia5, Tesla6, Backlinko7, Yahoo Finance8, Electrek, Inside Evs9,
Tesla Electric Vehicle Market Share and Prediction
Key Statistics
- In 20221, Tesla held a 62% share of the US electric vehicle market.
- Bank of America analysts estimated that Tesla’s share of the US electric vehicle market will decrease to 18% by 20261.
- In Q2 20232, Tesla’s overall US electric vehicle market share declined to 59% from 62% in Q1 of the same year.
- Tesla’s electric vehicle market’s share has decreased from 72% to 54% since January 20223.
- Tesla’s sales volume has been increasing despite the decline in market share. The company reached a new record of 422.875 units sold in Q1 20234.
Tesla Comparison with other Major Electric Vehicle Manufacturers
Tesla has managed to see success by focusing on premium electric vehicles (EVs). The company has several competitors among traditional carmakers such as BYD, SGMW, Volvo, Volkswagen, Audi, Mercedes and BMW.
Table Twelve: Comparing Tesla with Other EV Manufacturers for Q2 2023
| EV Manufacturers | Sales in Unit (Q2) |
| Tesla5 | 466,140 |
| SGMW9 | 286,400 |
| BYD6 | 251,685 |
| Volkswagen7 | 180,600 |
| BMW8 | 88,289 |
| Volvo* | 69,015 |
| Mercedes | 61,211 |
| Audi** | 41,100 |
Sources: CNBC1, Barrons2, Axios3, CNBC4, CNBC5, Reuters6, Inside EVs7, BMW Group PressClub8, GM Authority9, Inside EVs, Inside EVs*, Inside EVs**,
FAQs
In Q1 2023, Tesla reported revenue of $23.33 billion, and in Q2 2023, it reported revenue of $24.927 billion.
Tesla produced 920,807 vehicles and delivered over 889,015 vehicles after Q2 2023.
In Q2 2023, Tesla produced 479,999 units and sold 466,140 units. This became the record sales of a Tesla product for a single quarter.
The number of people employed by Tesla and its subsidiaries has increased steadily over the past decade, with over 127,000 jobs created.
The Model Y is Tesla’s highest selling product. In Q1 2023, it was the world’s best-selling car, surpassing Toyota’s RAV4 and Corolla models. Tesla sold 267,200 units of the Model Y in Q1 2023, with China being the biggest market for the electric SUV.
Elon Musk, Tesla’s CEO, has set a target to produce around 1.8 million vehicles by the end of 2023. However, it is important to note that meeting this target is not guaranteed, as it depends on various factors such as production capacity, demand, and supply chain constraints.
The United States had the highest number of Tesla sales out of any country in the world in 2022, with almost 50% of Tesla’s revenue generated in the US. China is the country with the second-most Tesla sales and Tesla’s second-largest market, with more than 22% of revenue generated in 2022.

